

At a glance
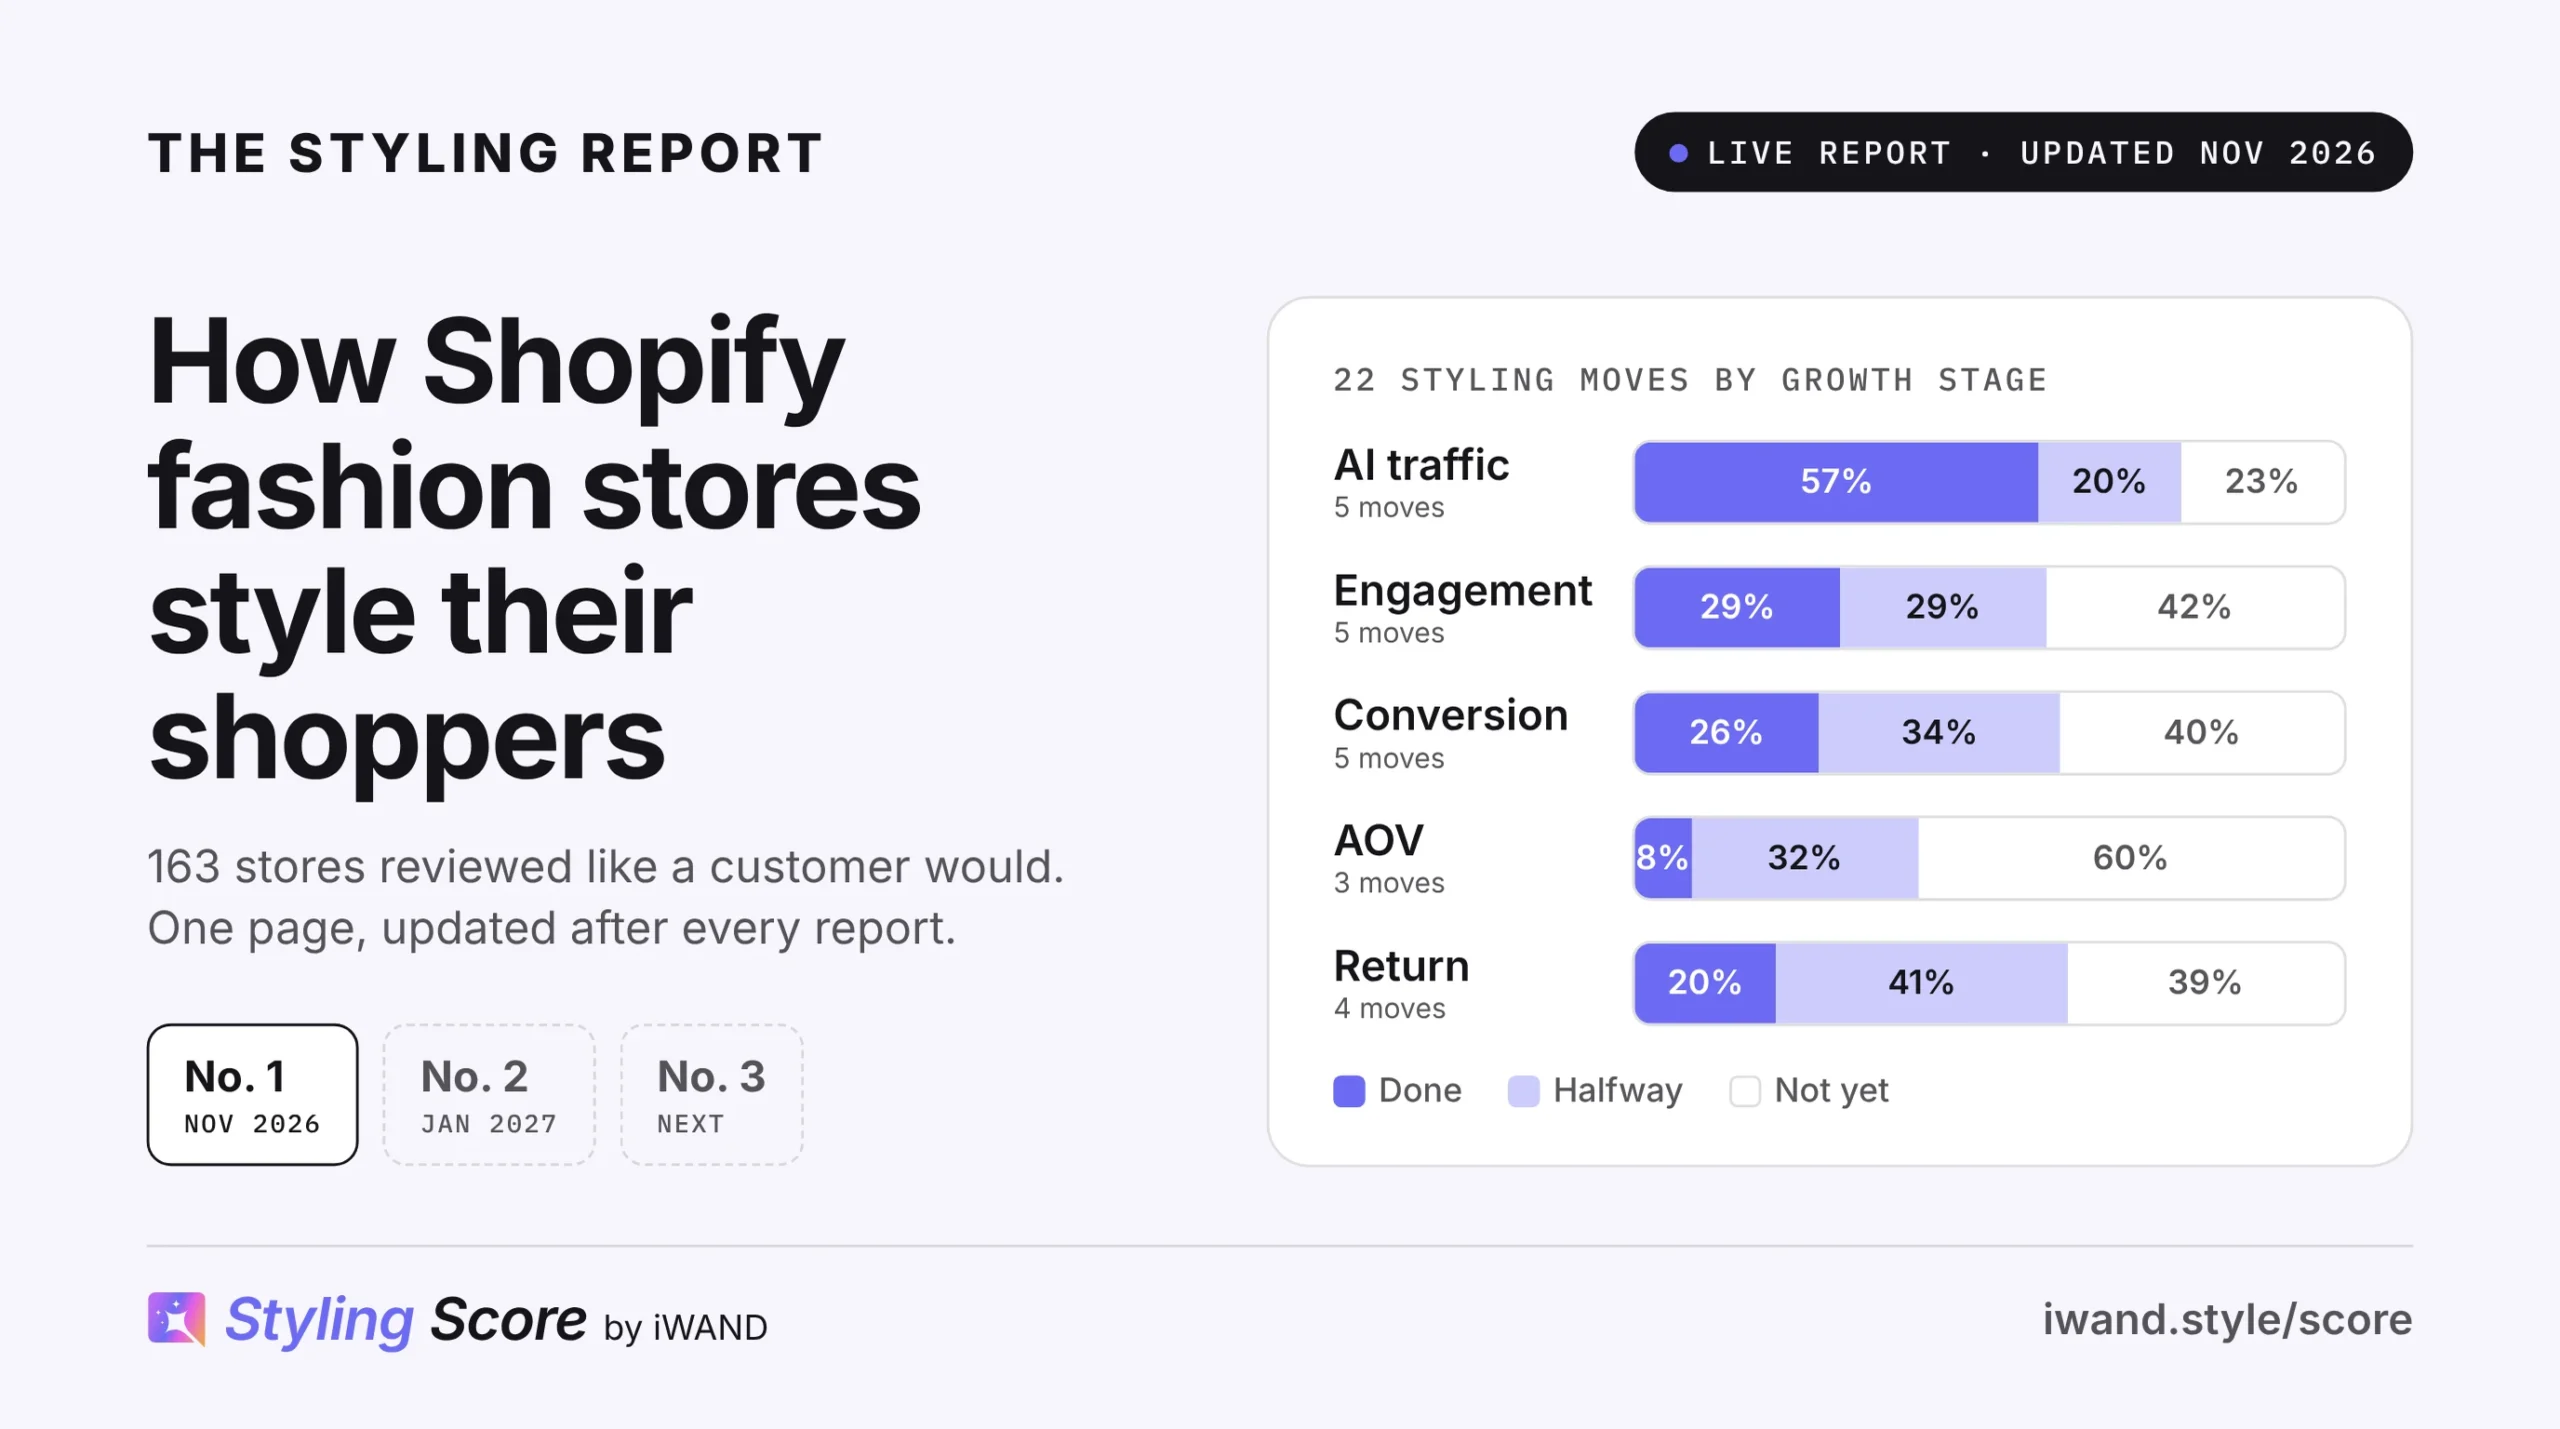
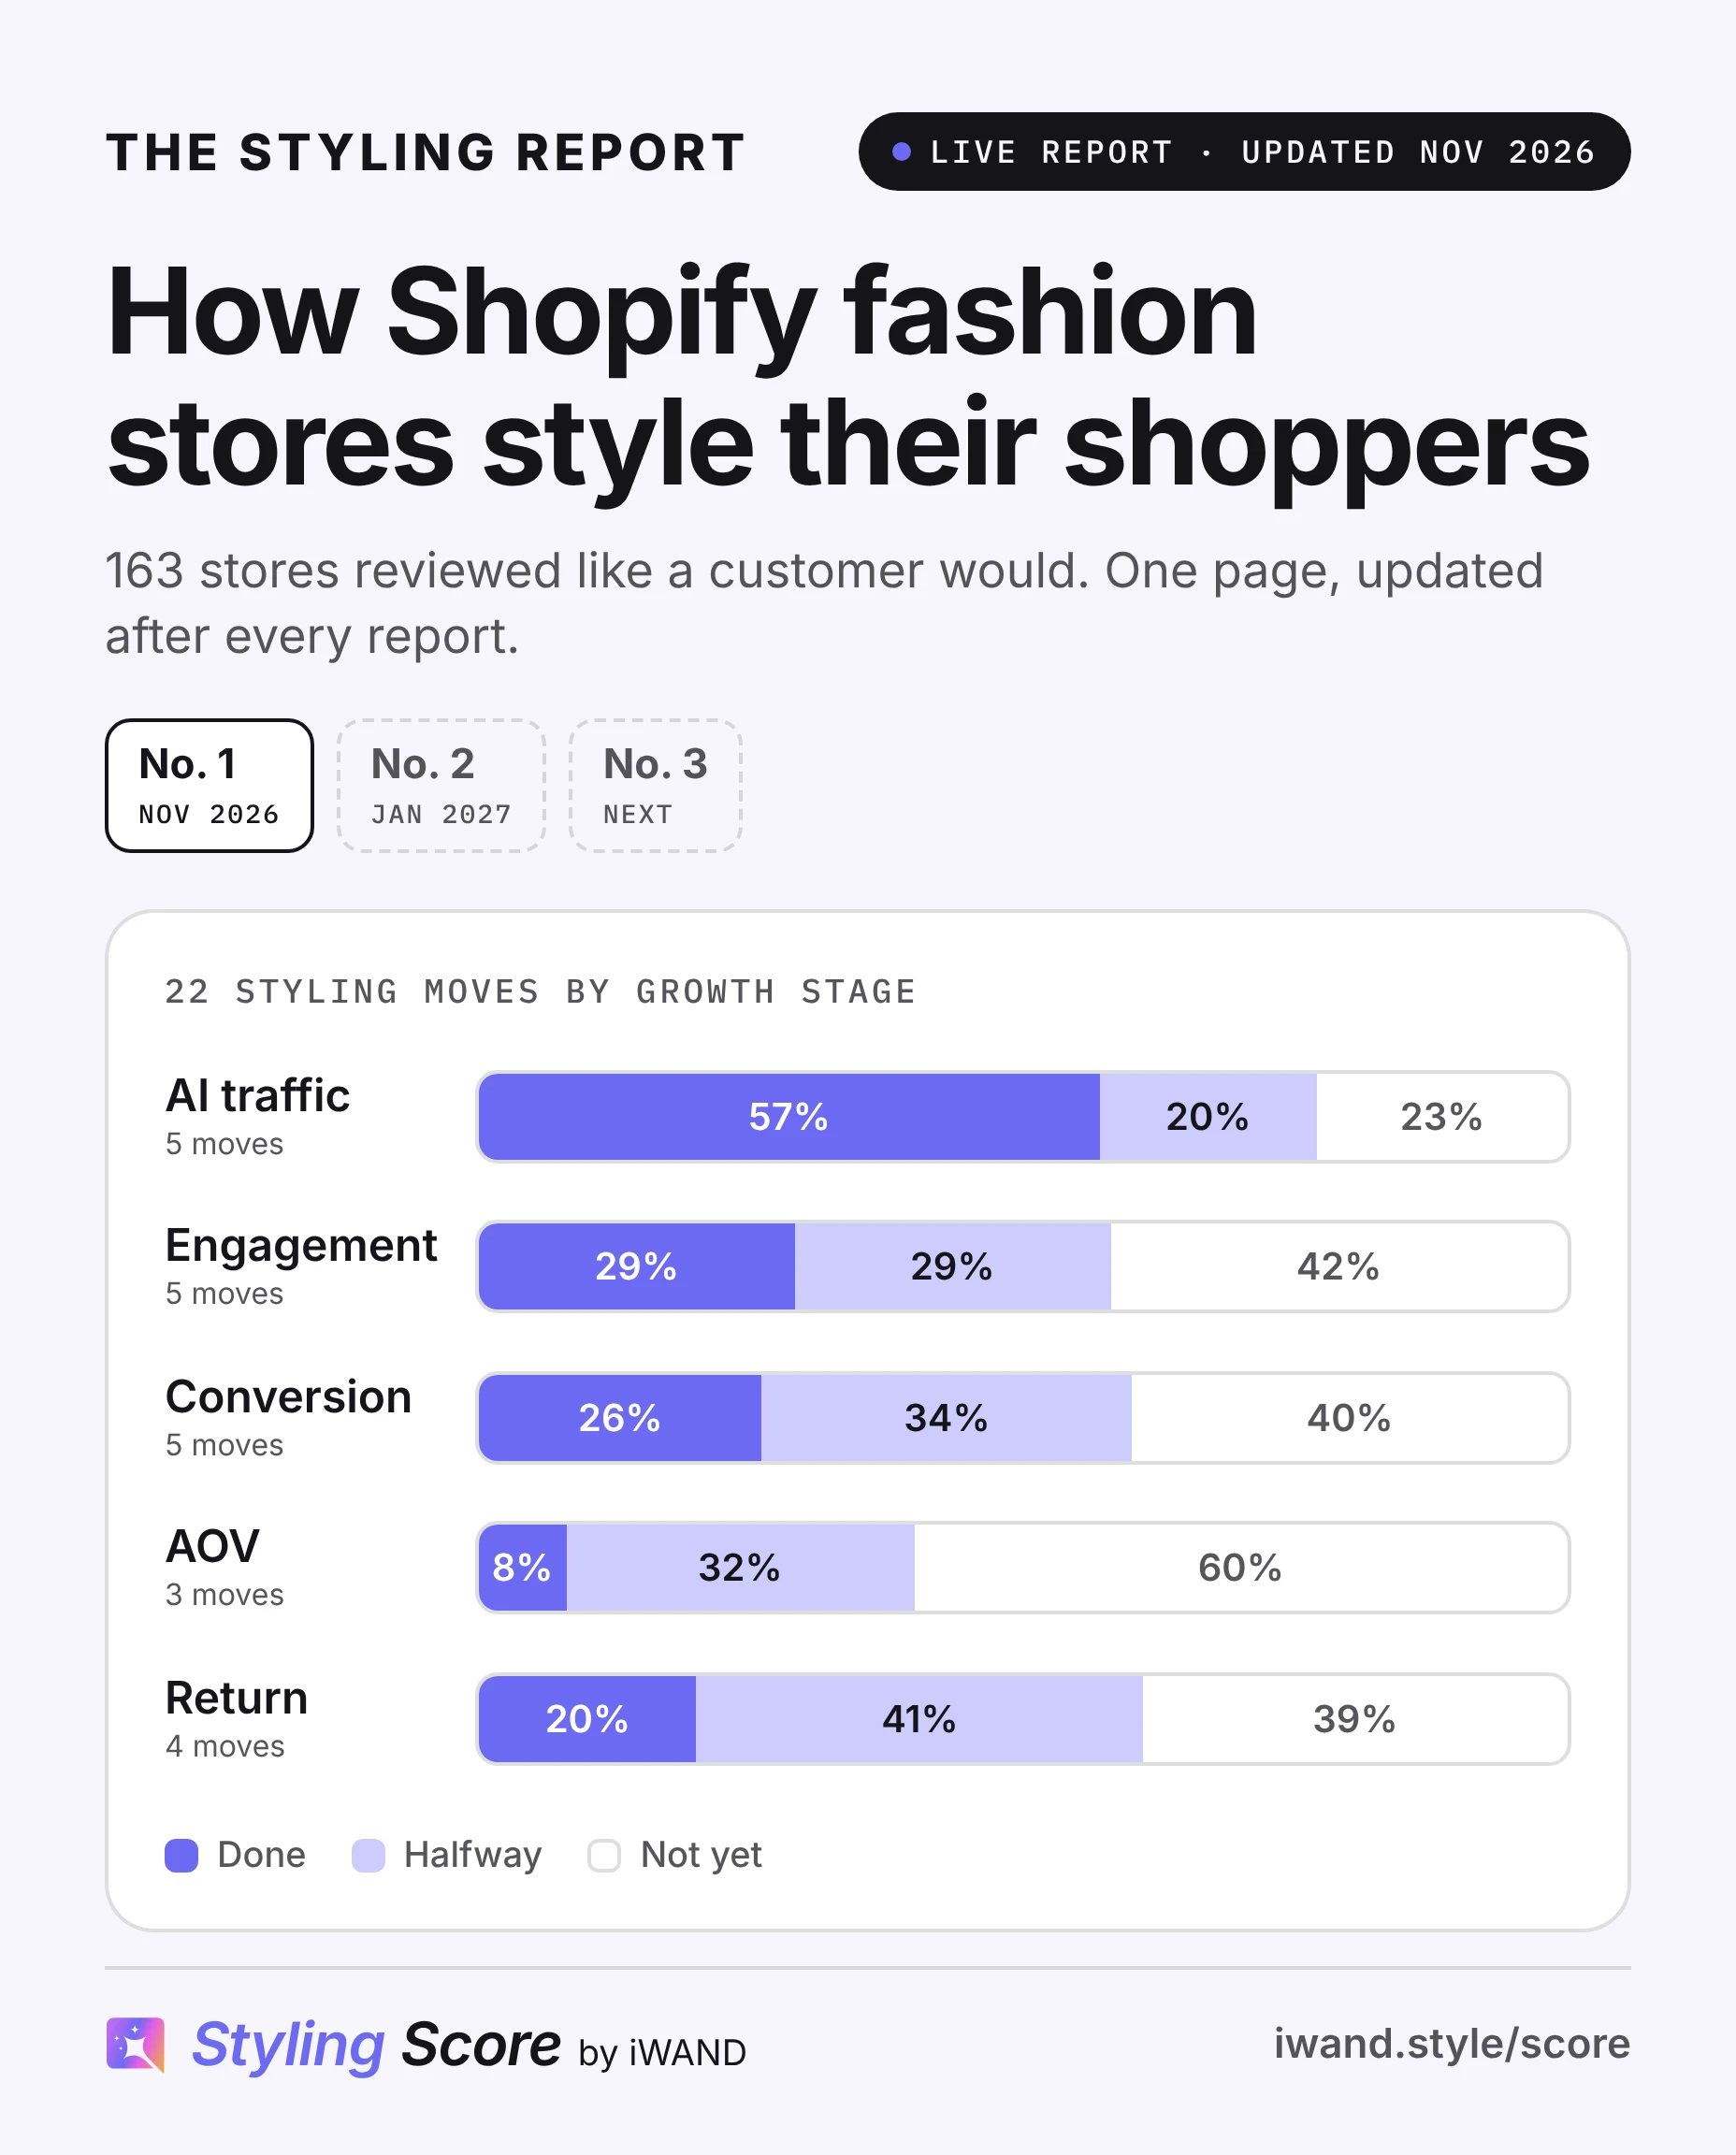
Across 163 Shopify fashion stores reviewed with the Styling Score since October 2026, the typical store has 6 of 22 styling moves done. Stores describe their products well but rarely style the shopper: AOV is the weakest of the 5 growth stages, with a median score of 21 out of 100, and only 7% let shoppers buy a full look in one step.
Stores reviewed: 163
Editions: 1
Updated: Nov 2026
Next edition: Jan 2027
Change log Nov 2026: first version, with the 163 stores from Styling Report No. 1 and a first split by store type.
Latest edition: Styling Report No. 1: Shopify fashion stores sell the piece, not the outfit. Only 7% of 163 stores let shoppers buy the full look in one step.
In this report
What is the Shopify Fashion Styling Report?
The Shopify Fashion Styling Report tracks how Shopify fashion stores style their shoppers. Every one to two months we review a new pack of stores with the Styling Score, publish a numbered report, and update this page with the running totals.
Styling means helping a shopper choose what to wear: the occasion, the outfit, the fit and whether it suits her. It is not personalization, which changes which products she sees based on what she did before. Styling answers what she is asking now.
| A salesperson store | A stylist store | |
|---|---|---|
| Starts with | The product | The person |
| Shows | One item at a time | Complete outfits |
| On size | Points to a size chart | Knows how this brand fits you |
| After the sale | Done | Remembers you and suggests new looks |
Good styling has two ingredients: it is personal to the shopper, and it follows real styling knowledge. For a fashion brand it has a third: it dresses shoppers the way the brand would.
How well do Shopify fashion stores style their shoppers today?
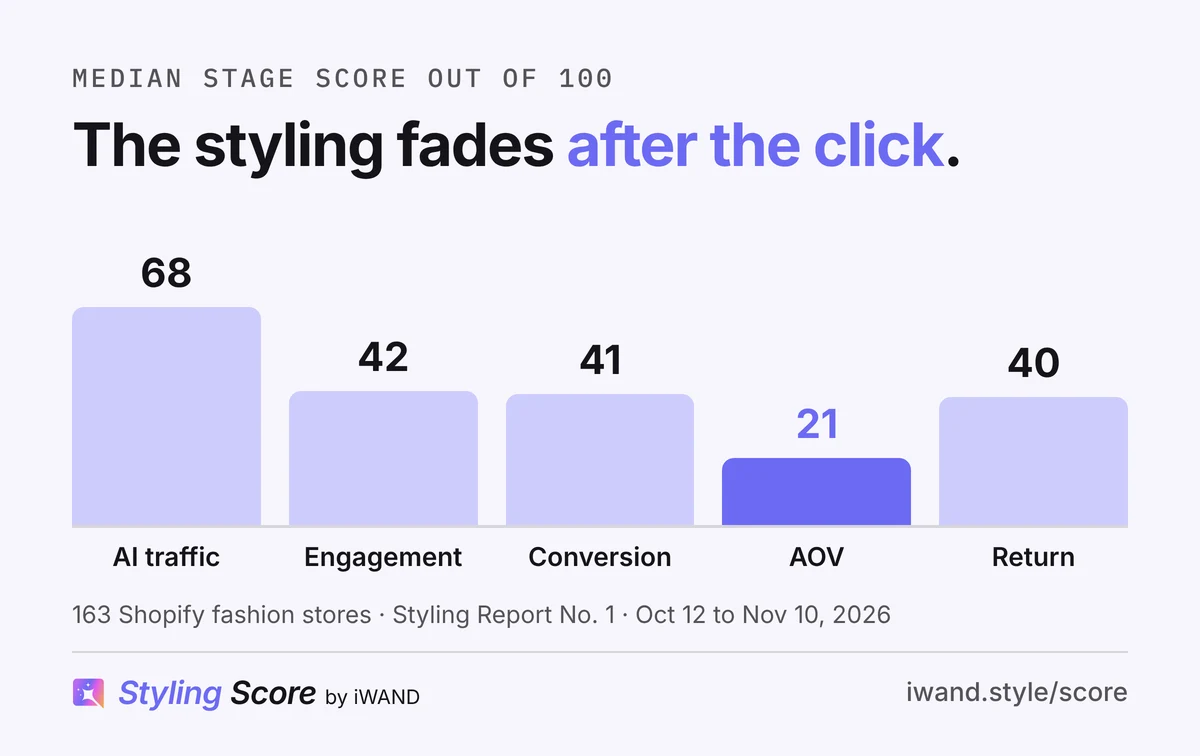
Stores are good at being found and at describing the product. After the click, the styling fades. AI traffic has the highest median stage score, 68 out of 100. Engagement, Conversion and Return sit around 40, and AOV is lowest, at 21.
| Measure | Value |
|---|---|
| Styling moves done by the typical store | 6 of 22 |
| Product basics done (names, brand style, fabric, size guide) | 76% of stores on average |
| Shopper moments done (occasion, looks, styling tips, fit from real people and 6 more) | 25% of stores on average |
| Stores that let shoppers buy the full look in one step | 7% |
| Stores offering some personal styling help | 110 of 163 |
The Styling Map: all 22 styling moves
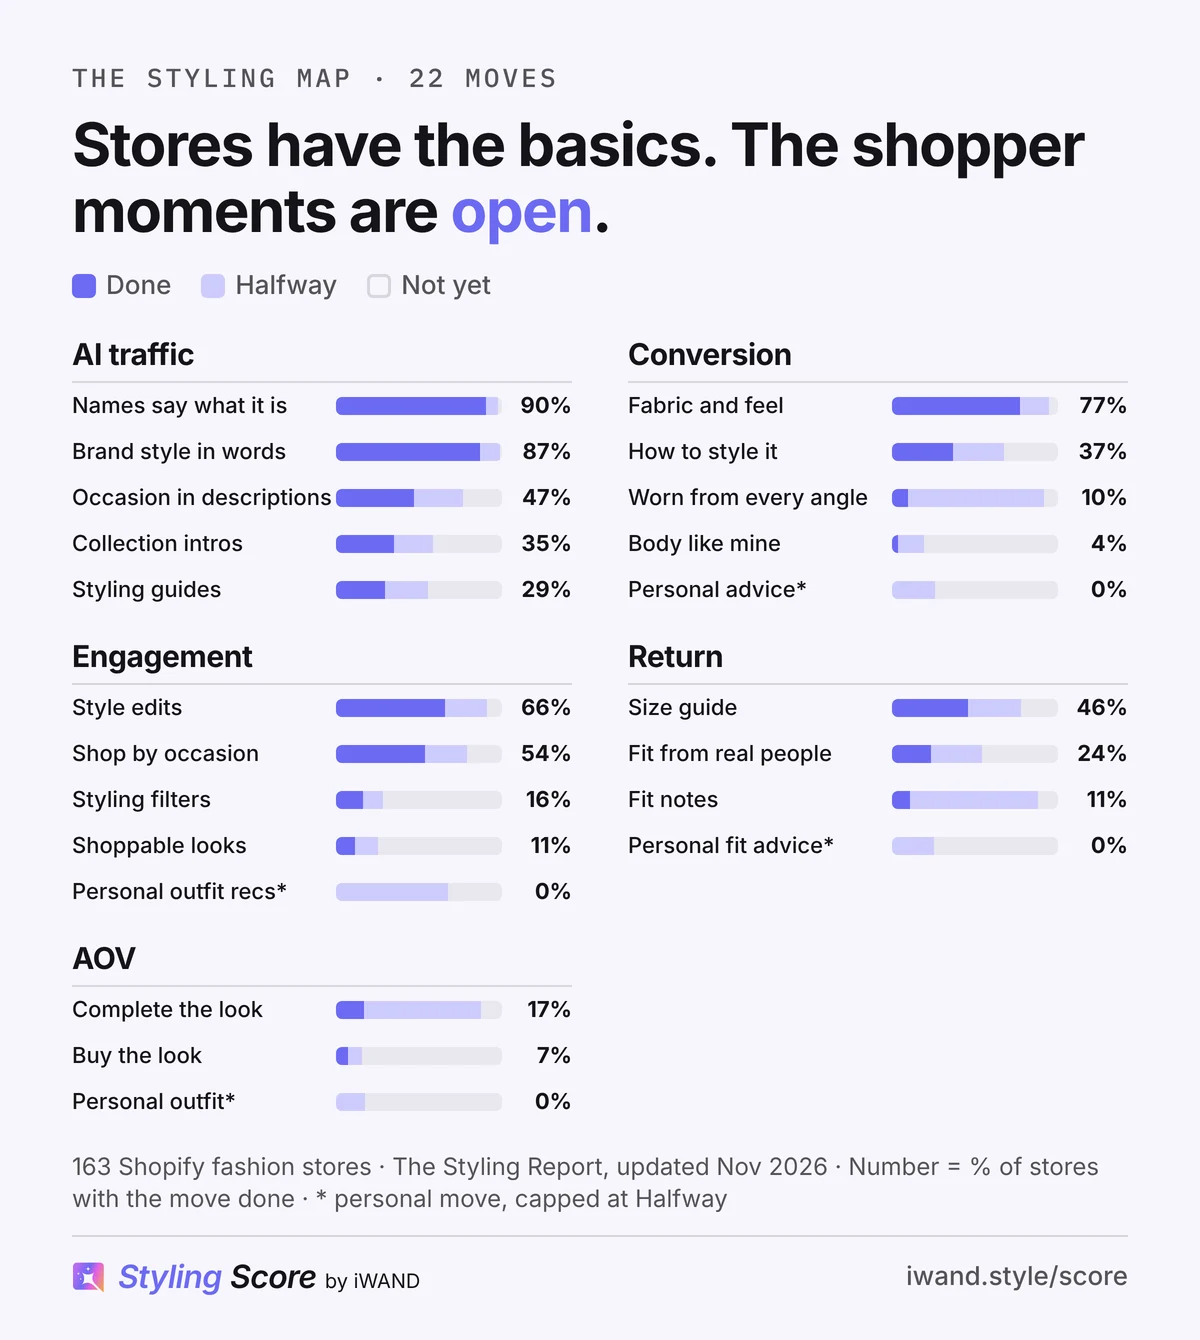
The Styling Map shows every move the Styling Score checks, and the share of stores at each status. The basics are mostly done; the moments where a shopper decides are mostly open.
| Stage | Styling move | Done | Halfway | Not yet | Stores counted |
|---|---|---|---|---|---|
| AI traffic | Occasion in descriptions | 47% | 30% | 23% | 162 |
| AI traffic | Names say what it is | 90% | 7% | 2% | 162 |
| AI traffic | Collection intros | 35% | 24% | 42% | 161 |
| AI traffic | Styling guides | 29% | 26% | 45% | 157 |
| AI traffic | Brand style in plain words | 87% | 12% | 1% | 162 |
| Engagement | Shop by occasion | 54% | 25% | 21% | 157 |
| Engagement | Shoppable looks | 11% | 14% | 74% | 149 |
| Engagement | Personal outfit recommendations* | 0% | 68% | 32% | 152 |
| Engagement | Style edits | 66% | 25% | 9% | 157 |
| Engagement | Styling filters | 16% | 12% | 71% | 147 |
| Conversion | Worn from every angle | 10% | 82% | 8% | 153 |
| Conversion | Personal styling advice* | 0% | 26% | 74% | 150 |
| Conversion | Body like mine | 4% | 15% | 81% | 131 |
| Conversion | Fabric and feel | 77% | 17% | 6% | 162 |
| Conversion | How to style it | 37% | 31% | 32% | 161 |
| AOV | Complete the look | 17% | 70% | 13% | 149 |
| AOV | Buy the look | 7% | 9% | 84% | 151 |
| AOV | Personal outfit* | 0% | 18% | 82% | 148 |
| Return | Size guide | 46% | 32% | 23% | 133 |
| Return | Fit notes | 11% | 77% | 12% | 146 |
| Return | Fit from real people | 24% | 31% | 46% | 140 |
| Return | Personal size and fit advice* | 0% | 25% | 75% | 151 |
How do stores style shoppers at each growth stage?
Each stage is a point where styling can grow a store, from being found by AI assistants to keeping what she buys. Here is where stores stand at each one.
AI traffic: median 68 out of 100
Most stores name their products clearly (90%) and describe their brand’s style in plain words (87%), so AI assistants can match them to what shoppers ask. Fewer write styling guides (29%) or collection intros (35%). How to grow AI traffic.
Engagement: median 42 out of 100
Style edits (66%) and shop by occasion (54%) are common. Shoppable looks (11%) and styling filters (16%) are rare, so most shoppers still browse a grid of single items. How to grow Engagement.
Conversion: median 41 out of 100
Fabric and feel is well covered (77%). Few stores show pieces worn from every angle (10% done, 82% halfway) or on more than one body type (4%). How to grow Conversion.
AOV: median 21 out of 100
The weakest stage. Complete the look is done at 17% of stores and halfway at 70%; buy the look is done at 7%. Most stores suggest a piece, not an outfit. How to grow AOV.
Return: median 40 out of 100
Size guides are done at 46% of stores. Fit notes are mostly halfway (77%), and fit from real people is done at 24%. How to grow Return.
Repeat purchase: not measured yet
The Styling Score does not yet check how a store brings shoppers back, such as remembering what she bought and suggesting new looks. See all six growth stages.
Do own brands style shoppers better than multi-brand stores?
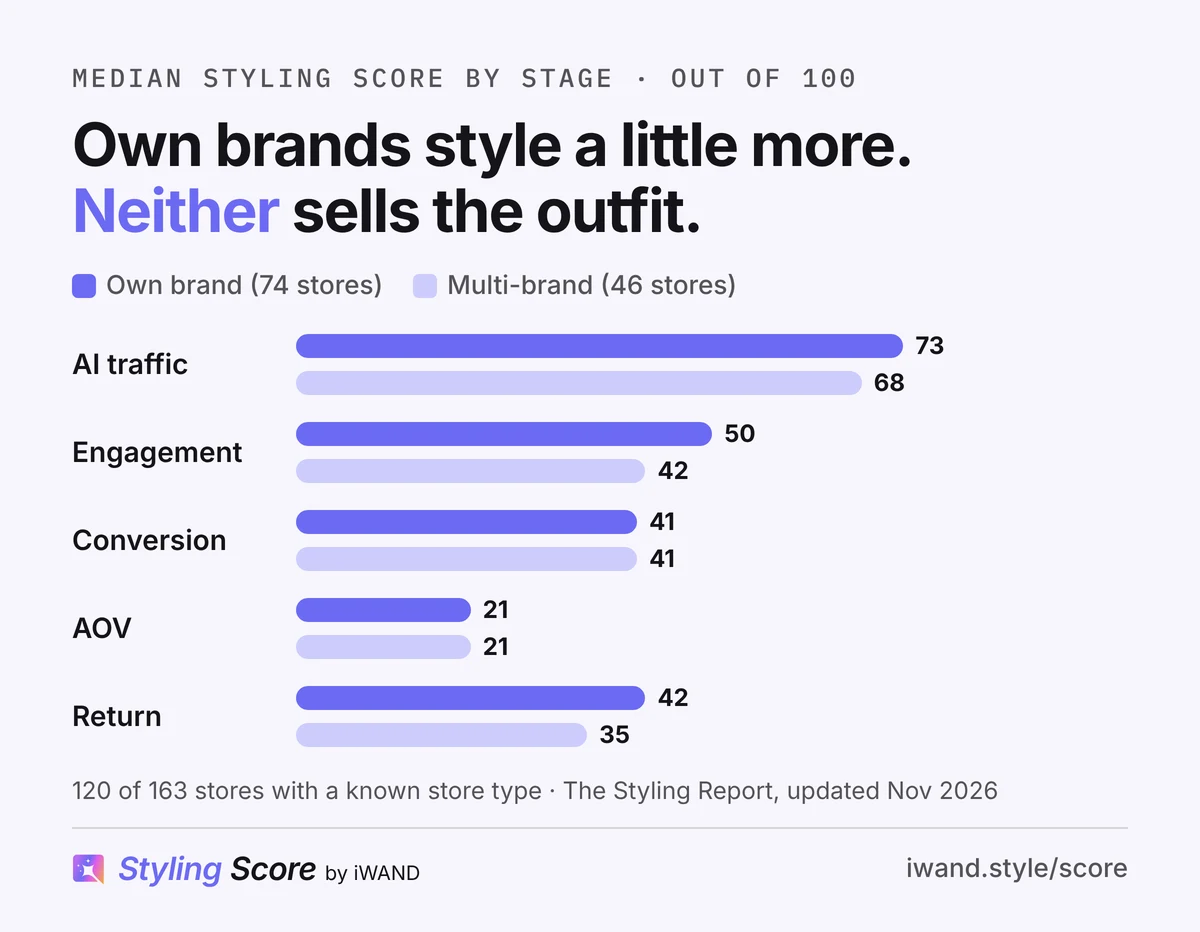
A little, but neither sells the outfit. Own-brand stores score higher at AI traffic (73 vs 68), Engagement (50 vs 42) and Return (42 vs 35). At AOV both score 21, and buy the look is done at 8% of own brands and 7% of multi-brand stores.
| Measure | Own brand | Multi-brand |
|---|---|---|
| Stores | 74 | 46 |
| Moves done (median) | 6.5 | 5.5 |
| Occasion in descriptions | 55% | 35% |
| Shop by occasion | 60% | 56% |
| Complete the look | 17% | 12% |
| Buy the look | 8% | 7% |
| Fit from real people | 29% | 18% |
This matters most for own brands. Their catalogue is designed to be worn together, so they are best placed to sell the outfit, and today most of them do not.
How do stores compare by country?
Indian stores in this sample score higher than US stores at AI traffic (80 vs 64) and Engagement (50 vs 42), and use shop by occasion more (73% vs 52%). Both score 21 at AOV.
| Measure | United States | India |
|---|---|---|
| Stores | 65 | 38 |
| Moves done (median) | 6 | 7 |
| AI traffic | 64 | 80 |
| Engagement | 42 | 50 |
| Conversion | 41 | 41 |
| AOV | 21 | 21 |
| Return | 40 | 45 |
| Shop by occasion | 52% | 73% |
| Buy the look | 10% | 3% |
Which Shopify fashion stores style their shoppers well?
These stores show what styling the shopper looks like. We list the moves each one does well, not a score. The list grows with every edition.
| Store | What it does well | Featured in |
|---|---|---|
| Alo Yoga | Starts from the activity, shows the full outfit and sells it in one step; fit notes and fit from real people | No. 1 |
| Really Wild Clothing Co | Names the occasion from description to menu, shows how to style each piece, on more than one body | No. 1 |
| NRBY | Shows each piece worn from every angle, explains how to style it, builds the outfit around it | No. 1 |
| Calibre, ITRH, Pangaia | The only stores in No. 1 with both complete the look and buy the look done | No. 1 |
Where does your store stand?
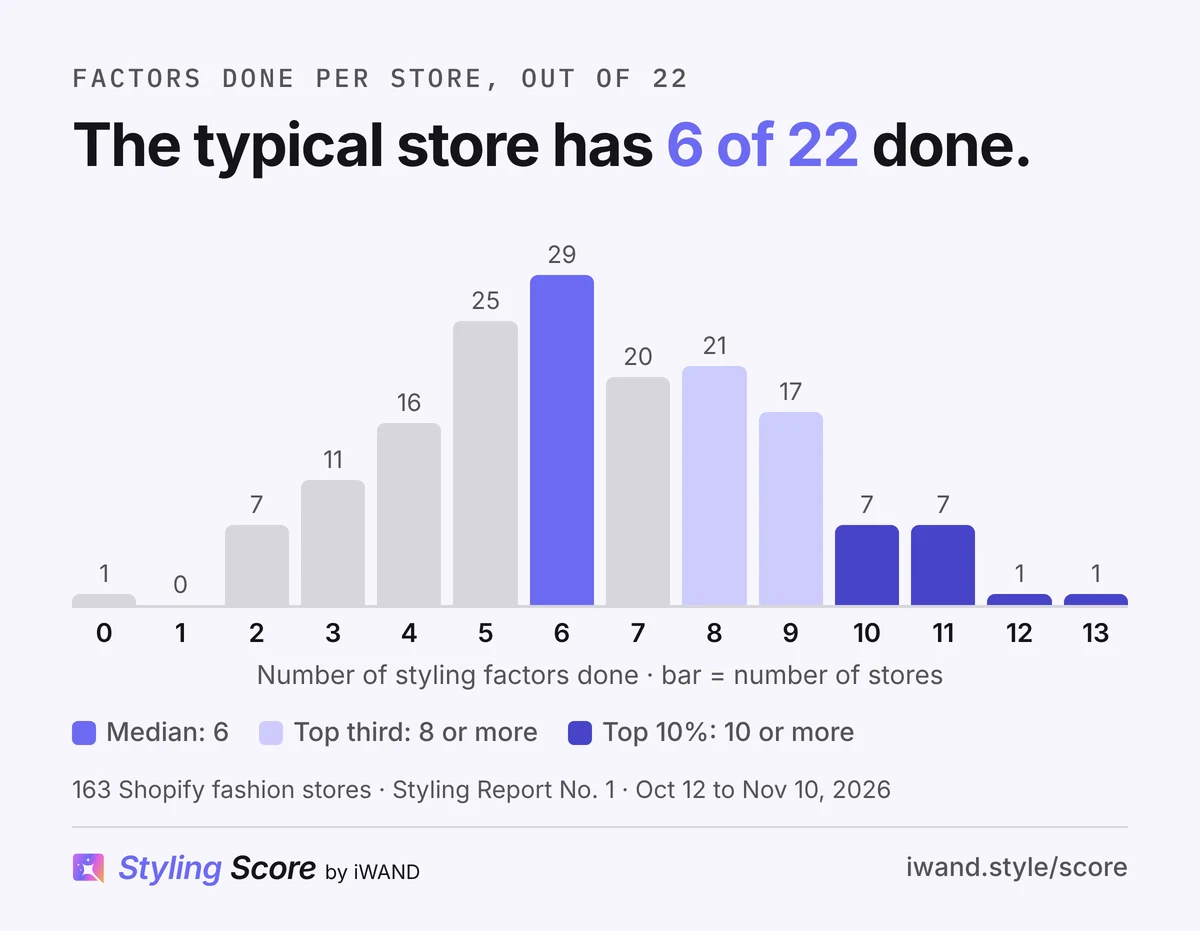
Count your Done moves and compare. The typical store has 6 of 22. The top third has 8 or more, the top 10% has 10 or more, and the highest so far is 13.
| Moves done (of 22) | Where that puts a store |
|---|---|
| 4 or fewer | Bottom fifth |
| 6 | The typical store |
| 8 or more | Top third |
| 10 or more | Top 10% |
Get all 22 checks for your store
The free Styling Score shops inside your store like a customer would, marks each move Done, Halfway or Not yet, and shows the fix for each one.
Every Styling Report
Each numbered report reviews a new pack of stores and looks at one theme in depth. Newest first.
| Edition | Published | Stores | Theme | Headline finding |
|---|---|---|---|---|
| No. 1 | Nov 2026 | 163 | Stores sell the piece, not the outfit (AOV) | 7% let shoppers buy the full look in one step |
| No. 2 | Jan 2027 (planned) | New pack | To be announced | Coming soon |
How do we review Shopify fashion stores?
We review each store with the Styling Score, which shops inside it like a customer would, using public pages only: the homepage and menus, collections, about 10 product pages, size guides, reviews and the blog.
- 22 moves, 5 stagesEach store is checked against 22 styling moves across AI traffic, Engagement, Conversion, AOV and Return.
- Three statusesDone means the move is in place across the store. Halfway means it is started or partial. Not yet means it is missing.
- Running totalsThis page counts each store once, using its latest review. A store reviewed again replaces its earlier result.
- TrendsChanges between editions are reported as trends only for stores reviewed more than once; otherwise we say the samples differ.
Read the numbers as this sample, not all of Shopify
The stores are well-known brands and independent stores we chose to review, not a random sample. A move a review could not read is left out of its count, so each percentage is based on 131 to 162 stores. In this version the Styling Score caps the four personal moves at Halfway, and it does not yet check repeat purchase.
| Date | Method change |
|---|---|
| Nov 2026 | First version: 22 moves across 5 stages; store type added from our store notes |
Data and how to cite it
You are welcome to reuse any number or table here with credit and a link to this page.
Download: the 22-move table (CSV), with stage, stores counted and the Done, Halfway and Not yet shares.
Cite as: iWAND, The Shopify Fashion Styling Report, updated November 2026, 163 Shopify fashion stores reviewed with the Styling Score. iwand.style/blog/shopify-fashion-styling-report/
Questions about the Styling Report
What percentage of Shopify fashion stores offer complete the look?
Complete the look is done at 17% of the 163 Shopify fashion stores reviewed so far and halfway at 70%, usually as a block of related products rather than a styled outfit. Only 7% let shoppers buy a full look in one step.
How many styling moves does a typical Shopify fashion store have?
The typical store has 6 of the 22 styling moves in the Styling Score done. The top third has 8 or more, and the top 10% has 10 or more.
Which growth stage is weakest for Shopify fashion stores?
AOV, with a median Styling Score of 21 out of 100. AI traffic is the strongest at 68; Engagement, Conversion and Return sit around 40.
Do own-brand stores style shoppers better than multi-brand stores?
A little. Own brands score higher at AI traffic, Engagement and Return, but both score 21 at AOV and rarely let shoppers buy the full look.
Is styling the same as personalization?
No. Personalization changes which products a shopper sees, based on what she did before. Styling answers what she is asking now: what to wear it with, how it fits and whether it suits her.
How often is the Styling Report updated?
Every one to two months. Each edition adds a new pack of stores, and this page is updated with the running totals and a new change log line.
Can my store be reviewed?
Yes. Run the free Styling Score on your store to see all 22 moves, stage by stage, with the fix for each one.
Latest edition
Styling Report No. 1
Shopify fashion stores sell the piece, not the outfit.
Next read
Shopify fashion benchmarks
Conversion rate, AOV, returns and repeat purchase, stage by stage.